Part 2: New Setup, Early Heat, and What Stuck Around
After the baseline post, I watched a bunch of YouTube videos on dice setting. Based on what I picked up, I reconfigured my home setup to replicate shooting from Stick Left 1, and switched to a hardway set — 5s on top, 1s facing me. New player profile too ("Jim Hardway Set"), kept separate from the baseline so the two datasets don't blend together.
300 rolls in, it looked real
The first checkpoint came at 33 hands, 299 rolls. SRR came in at 6.64 — enough above the 6.0 random baseline to flag green — and every single hardway number was running hot: Hard 4 at 39.1% against a 33.3% expectation, Hard 6 at 23.3% (expected 20%), Hard 8 at 23.6% (expected 20%), Hard 10 at 46.4% (expected 33.3%). All four, elevated, all four green.
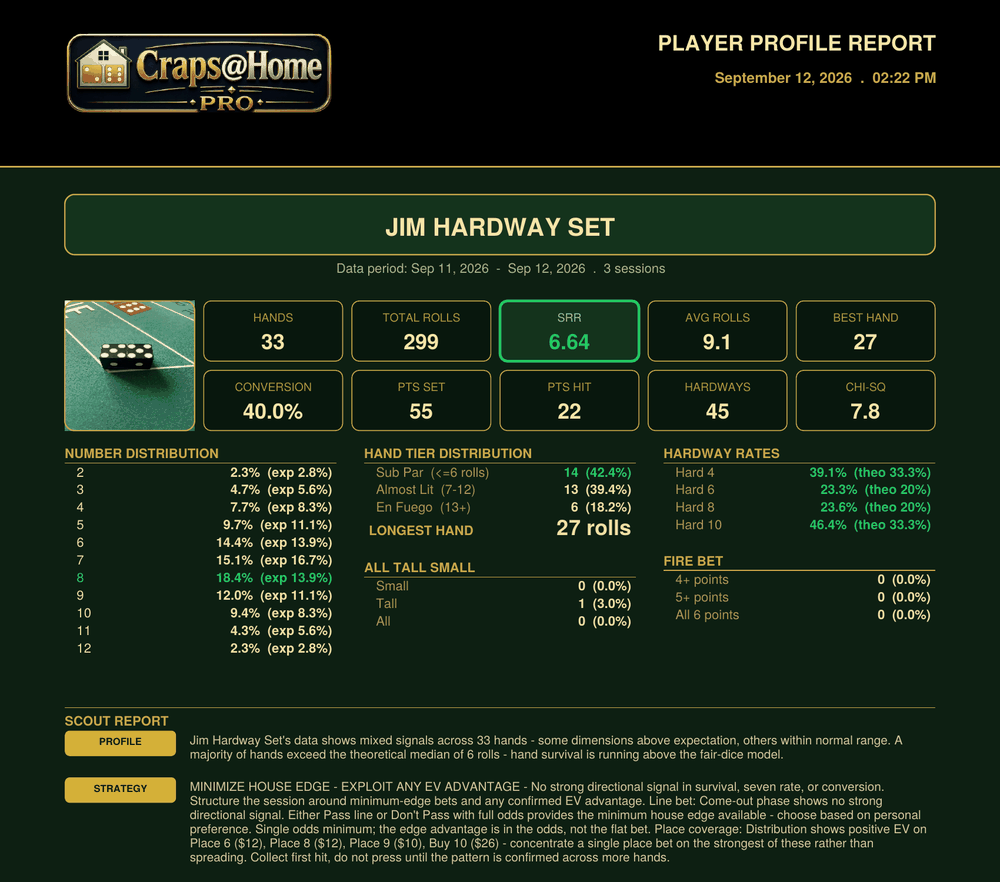
Chi-squared didn't move though — 7.8, nowhere near the significance bar. So even at its best, this wasn't a "proof" moment, just an elevated SRR and a striking hardway pattern. The hardway frequency wasn't just something the report said, either — I'd noticed it myself at the table before I ever looked at the numbers. This in itself is an interesting commentary on Chi-squared. It's looking at the values of the numbers and does not factor in whether the value was "hard" versus "soft". If it is truly influence-able, this could lead to an edge against the house.
By 400 rolls, most of it faded
Next checkpoint: 47 hands, 402 rolls. SRR settled back down to 6.28 — not flagged anymore. Chi-squared, still unremarkable at 7.4. And the hardway pattern that looked so consistent at 300 rolls mostly went with it: Hard 4 dropped to 29.0% (now actually *below* the 33.3% expectation, colored red), Hard 6 and Hard 8 both settled in close to their theoretical rates.
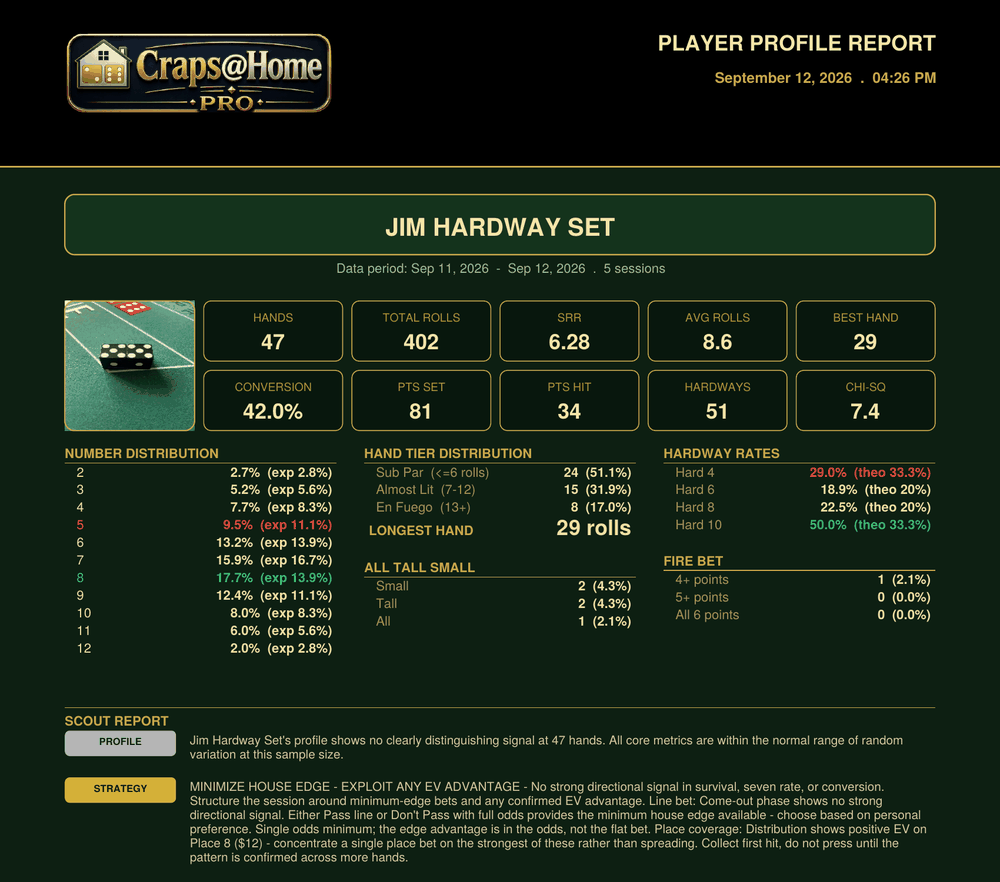
I'd felt that fade before I saw the report confirm it, too — the hardway rolls that felt frequent early just stopped standing out. Hard 10 is the one exception. It's still running at 50.0% against a 33.3% theoretical rate, the only hardway number that held up across both checkpoints.
All Tall Small are happening at a higher rate
This is the one I didn't expect going in. Compared to the original baseline — Small at 2.3%, Tall at 2.2%, All at a bare 0.1% — the current numbers are meaningfully higher across the board: Small and Tall both around 4.3%, and All up to 2.1%. That's a real jump, not a rounding difference, and it's shown up consistently rather than appearing once and vanishing the way the early hardway signal did.
One number (Hard 10) and one category (ATS) stuck around through a real regression-to-the-mean stretch. Everything else that looked exciting at 300 rolls quietly normalized by 400. Still just two data points on metrics that need a lot more rolls before they mean anything on their own.
Definitely a noticeable change, having been at this for — let's say — a while now. We'll see if it holds as more hands get rolled into the dataset.
Read Part 1: Establishing My Baseline →